SSRP Abstract
MAPPERing Communities of Interest
 Student: Leia Ashikawa ’21
Research Mentor: Courtney Thatcher (University of Puget Sound Department of Mathematics)
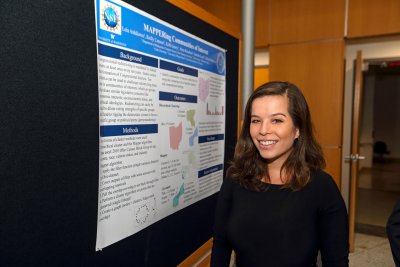
Congressional redistricting is mandated by federal law at least once every ten years. However, states control the formation of Congressional districts. There are ten factors established where states can challenge redistricting plans. One example is communities of interest, which are groups that share similar demographics including economic interests, socioeconomic status, and political ideologies. Redistricting of these groups were specifically studied due to their high tendency of being manipulated. Orchestrating the districts can easily be used to dilute the voting strength of specific communities to favor one political party. To study these changes, two forms of cluster methods were used: hierarchical clustering and the Mapper algorithm. Outputs from both cluster methods were used to detect and compare these communities. Census data collected from Ohio back in 2010 was emplaced into an Ohio shape file utilizing block group data regarding age, income, race, veteran status, and industry. Due to time restrictions, emphasis was placed on Cincinnati, Cleveland, and Ohio as a while when inputting the logged data into the Mapper and Hierarchical algorithms. The synthesized data from these systems had a clear distinction between the two programs. Although the Hierarchical system binned a few Block Groups, including similar cluster groupings which grew exponentially, it was lacking information in comparison to the Mapper. Specifically the hierarchical cluster forced the majority of the Block Groups into the final cluster, therefore making the entire state a Block Group. Mapper created a more detailed explanation of the redistricting, specifically focusing on non-white, college aged, and low income populations in Cincinnati. Cleveland also registered a high centralization within the college populations. Other groupings registered by Mapper included older generations, wealthy populations, and non-white groupings. In the entirety of Ohio, clusters were formed in both urban and rural areas, highlighting cities specifically. Had more time been allotted, further studies could have been conducted in other regions to provide more data with different parameters.
There are ten different criterias in which a state can take to court whether or not a Congressional district map is gerrymandered. One of the criterias being communities of interest, we used the map of Ohio to examine the clusters of communities of interests, in order to identify patterns that could be used for a potential Congressional district map.
